The Dashboard
Dashboard KPI's
KPI stands for "Key Performance Indicators." KPIs are metrics used to measure the performance of a business, organisation, or individual in achieving specific goals or objectives.
KPIs are often used to track progress towards strategic objectives, monitor performance against industry benchmarks, and identify areas for improvement. They can be quantitative or qualitative, and may be applied across various business functions, such as sales, marketing, finance, operations, and customer service.
KPIs should be chosen carefully based on their relevance to business objectives, their ability to be measured accurately and consistently, and their capacity to inform decision-making and drive meaningful change.
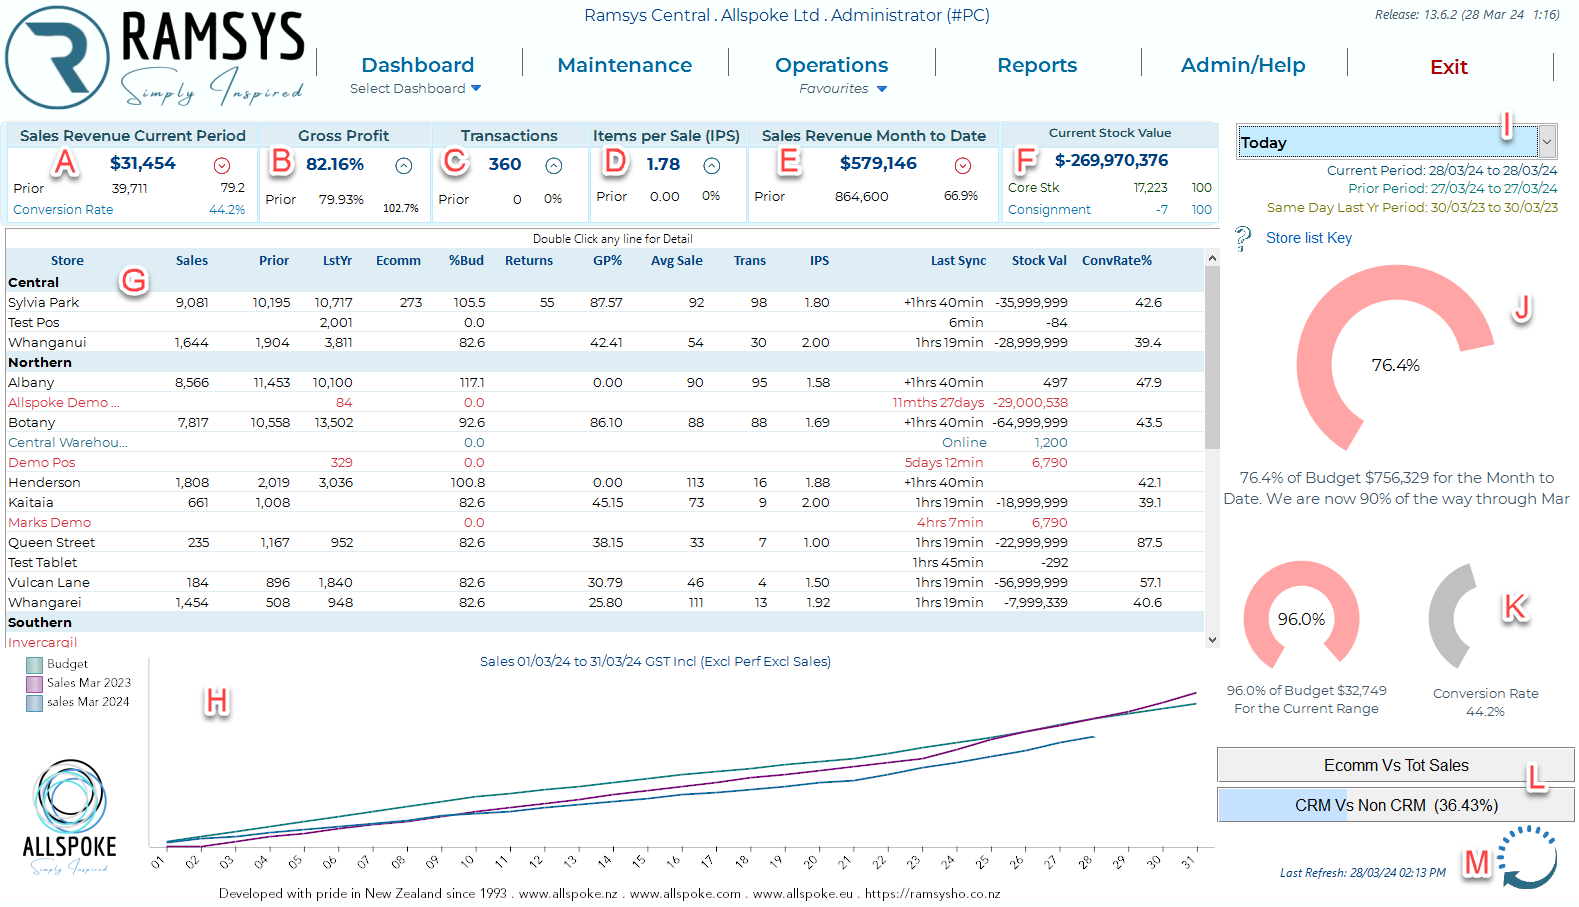
Ramsys offers several dashboards, with the primary default one being displayed below. You can navigate to other dashboards by clicking the "Dashboard" submenu. To set any dashboard as your default, simply click the "Set Default Page" option located on the right side of the page.
The Main screen displays some useful KPI's (Key Performance Indicators) to provide you with an easy to read overview of the companies performance.

A |
Sales Revenue |
Total Sales |
B |
GrossProfit |
The gross profit expressed as a % |
C |
Transactions |
The Number of Sales transactions for the period |
D |
IPS |
The average number of items in each sale |
E |
Sales MTD |
Sales totalled Month to Date |
F |
Stock Values |
Total Stock holding based on Average cost per store
|
G |
Active Stores |
Daily Statistics for the stores and the last successful update from that store. Only stores set to active in the location master will display here. Click on a column header to sort by that column
|
H |
Sales Graph |
Graphical view of Sales Vs Budget Vs Sales for the same period last year |
I |
Period Selector |
Select the date range for the current period, the prior range will set automatically off this.
|
J |
Sales Vs Budget |
An easy to read gauge display of sales Vs Budget.
|
K |
Conversion Rate |
A % to provide how many of the customers entering the store are being converted to Buyers. |
L |
Meter graphs |
A representation of
|
M |
Refresh |
The last refresh of the dashboard, this will refresh automatically on a regular basis. You may refresh at any time by clicking the refresh icon. |
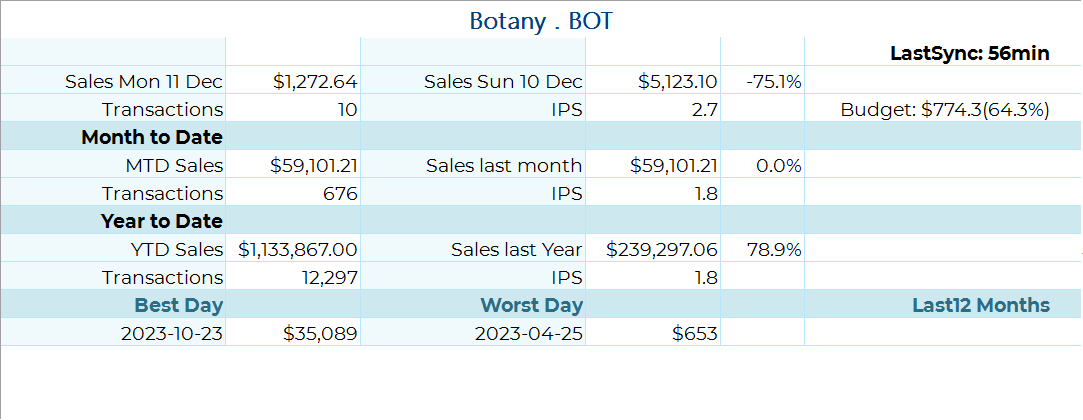
Store Detail
If you wish to see further detail on any store simply double click the desired store in the grid (G)
