Operational Analysis
Operational Analysis
Reports/Sales/Operational Analysis
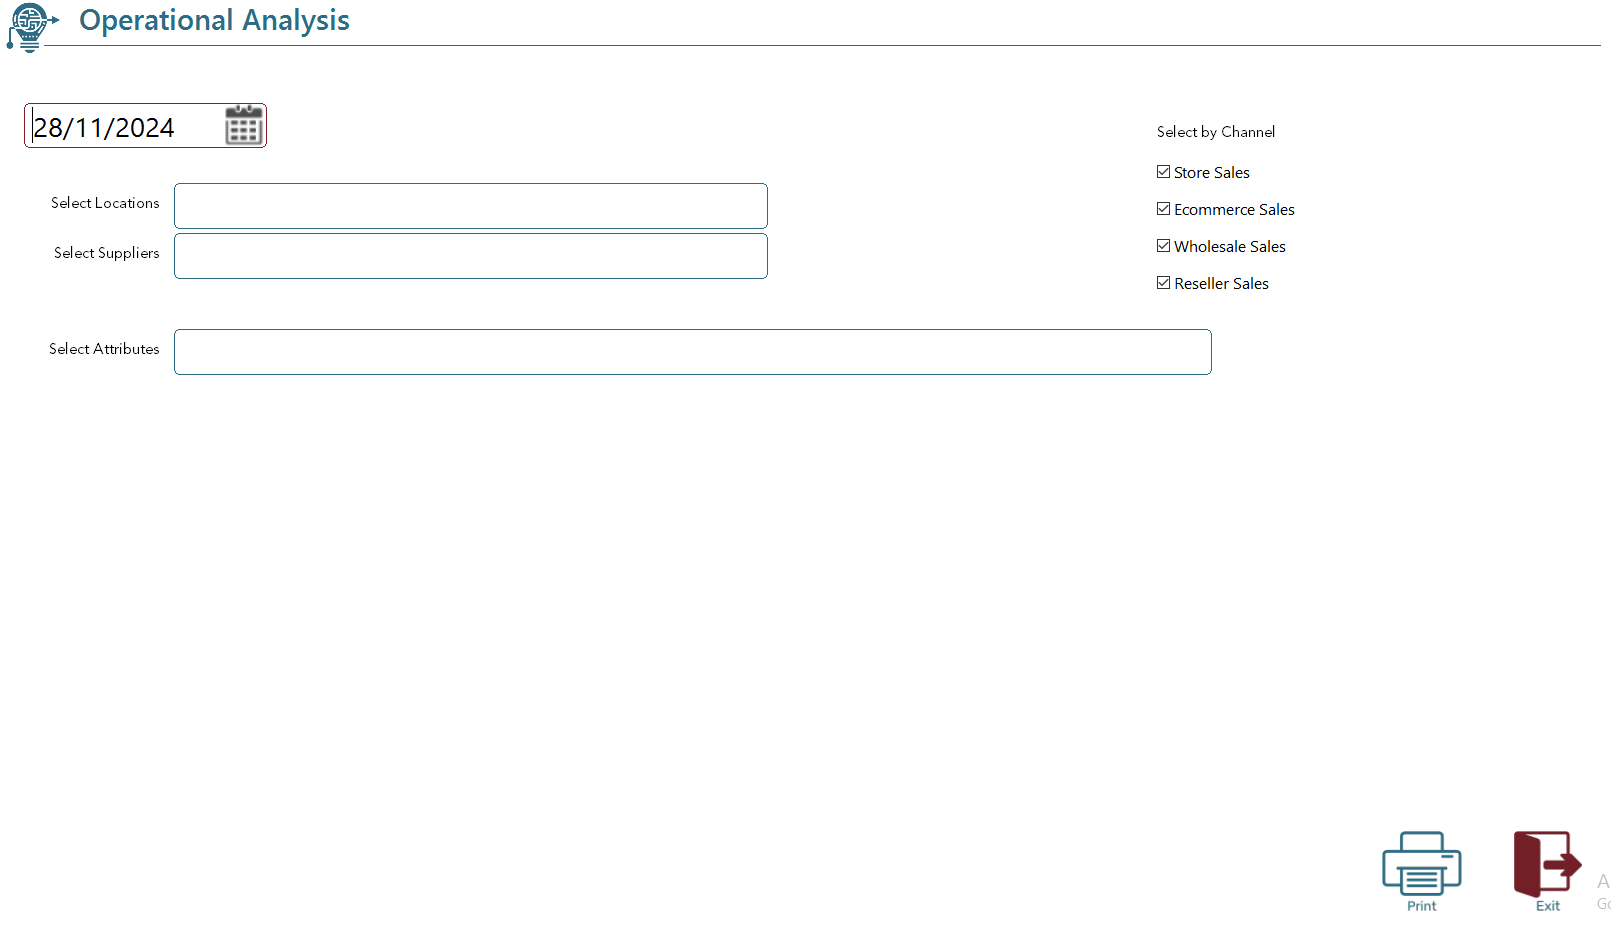
The Operational Analysis Report provides a comprehensive snapshot of your business data for any selected date. This powerful tool allows you to analyse sales and inventory data across all locations, giving you a clear picture of operational performance up to the chosen date.
Key Features:
- Data Coverage:
- Displays sales and inventory data across all business locations.
- Includes all transactions up to the selected date.
- Comparative Analysis:
- Easily compare performance metrics for:
- Current Day
- Week-to-Date (WTD)
- Month-to-Date (MTD)
- Year-to-Date (YTD)
- Supports both calendar year and financial year comparisons.
- Trend Identification:
- Quickly spot operational trends to identify opportunities for growth or areas needing improvement.
- Gain insights into sales performance and inventory movements over time.
How to Use the Report:
- Select a date from the date picker to define the analysis period.
- You may filter the results further as below if desired.
- Review the displayed data, which is organised for easy interpretation.
- Use the comparison tools to evaluate performance across different time frames.

This report is designed to help you make informed decisions and optimise your operations by providing actionable insights at a glance.

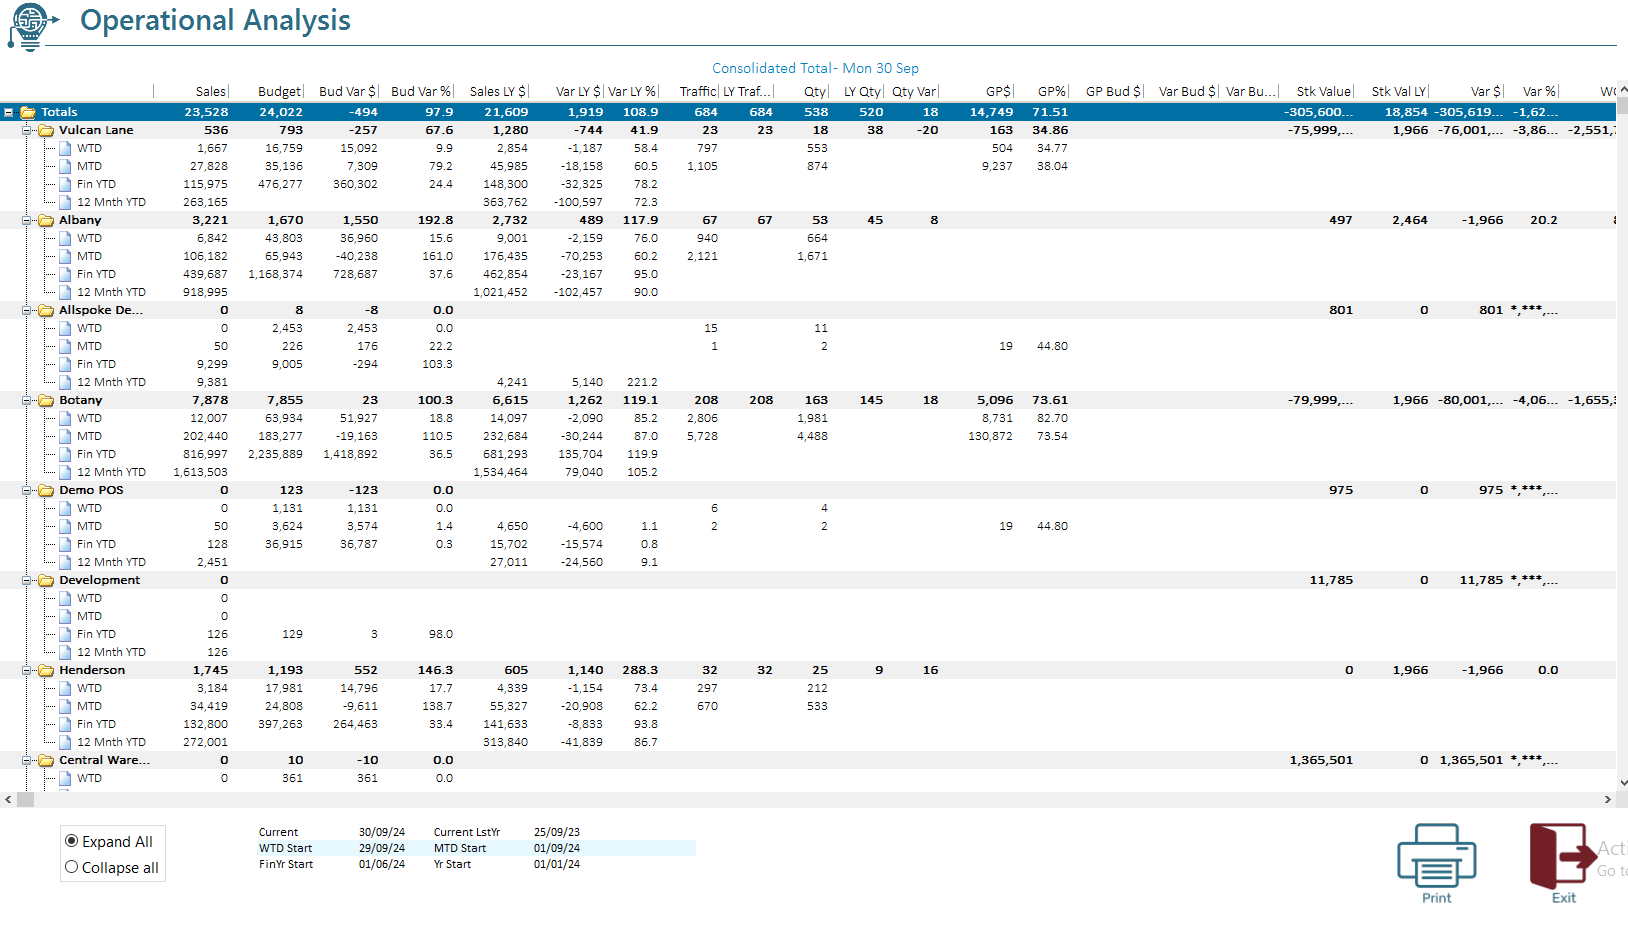
The Summary Tree feature provides a detailed visualisation of sales, stock, and performance metrics. It organises data into hierarchical nodes such as Consolidated Totals, Locations, and Date-Based Summaries (e.g., Week to Date, Month to Date). Each node is populated with key performance indicators (KPIs) like sales, budget, traffic, and stock values.
This feature is interactive, with nodes colour-coded, expandable, and sortable, making it easier to analyse the performance of the business.
Structure and Functionality
1. Consolidated Totals
The top-level node displays overall performance metrics for the selected date. The following data points are included:
- Today’s Sales: Total sales for the current day.
- Today’s Sales Budget: The planned sales target.
- Sales Variance: Difference between actual sales and budgeted sales.
- Sales Growth (%): Percentage growth compared to the sales budget.
- Last Year’s Sales: Sales data for the same day last year.
- Year-over-Year Sales Growth (%): Comparison between this year’s and last year’s sales.
Other metrics include:
- Traffic and Traffic Comparison (current vs. last year).
- Quantities Sold (today and last year).
- Stock Values: Current and last year’s stock values, with comparisons.
Each metric is highlighted in a dedicated column, and consolidated totals are visually emphasised using a bold font and a distinct colour scheme.
2. Locations
The second-level nodes represent individual locations. Each location displays:
- Sales Data (actual, budgeted, variance, and growth %).
- Traffic Metrics (current and last year).
- Quantities Sold (today and last year).
- Stock Metrics: Values and variances.
Additionally, location-specific metrics such as Sales per Transaction and Sales per Unit Sold are calculated for deeper analysis.
3. Date-Based Summaries
Week-to-Date (WTD)
This section provides performance metrics for the week up to the current day:
- Week-to-Date Sales: Actual and budgeted sales for the week.
- Variance and Growth (%): Difference and percentage growth from the budgeted values.
- Traffic, Quantities Sold, and Stock Values: Week-to-date figures compared to historical data.
Month-to-Date (MTD)
This section extends the analysis to the entire month:
- Metrics include sales, budget comparisons, variances, and growth percentages.
- Additional KPIs such as Sales per Unit Sold and Traffic Analysis are included.
Data Visualisation
Metrics are displayed in tabular columns, with calculated values for variances and growth percentages. If a metric is unavailable (e.g., no budget or last year’s data), the corresponding field will be blank or omitted.
Usage Instructions
- Access the Summary Tree:
- Navigate to the desired section of the application where the summary tree is displayed.
- Explore Data:
- Expand or collapse nodes to view detailed or summarised data for each level.
- Analyse Metrics:
- Use the visual cues (colours, bold fonts) to quickly identify trends and variances.
- Interpret Calculations:
- Each metric (e.g., sales growth %) is pre-calculated and displayed in a user-friendly format.
Example 1: Consolidated Totals
- Today’s Sales: $10,000
- Today’s Sales Budget: $9,000
- Sales Variance: +$1,000
- Growth: +11%
Example 2: Location Performance
- Location: Downtown Store
- Today’s Sales: $5,000
- Last Year’s Sales: $4,500
- Sales Growth: +11%
- Traffic: 200 customers
Tips for Effective Use
- Regularly monitor Consolidated Totals for overall performance insights.
- Drill down into Location Nodes to identify individual store trends.
- Use Date-Based Summaries to track weekly and monthly progress.