KPI DashBoards
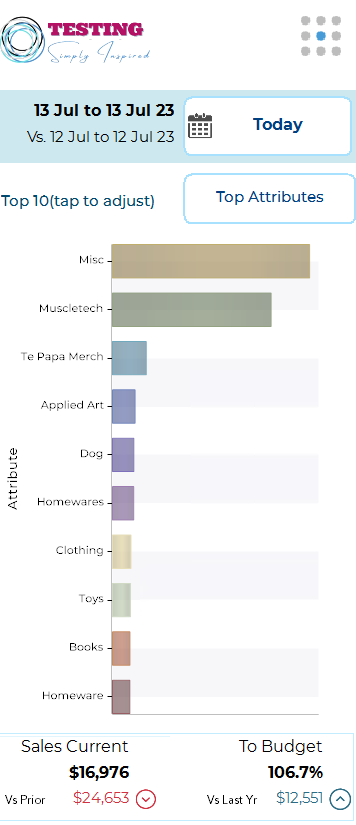
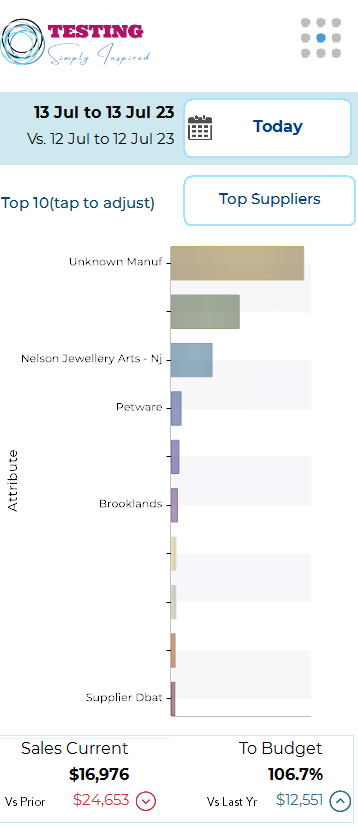
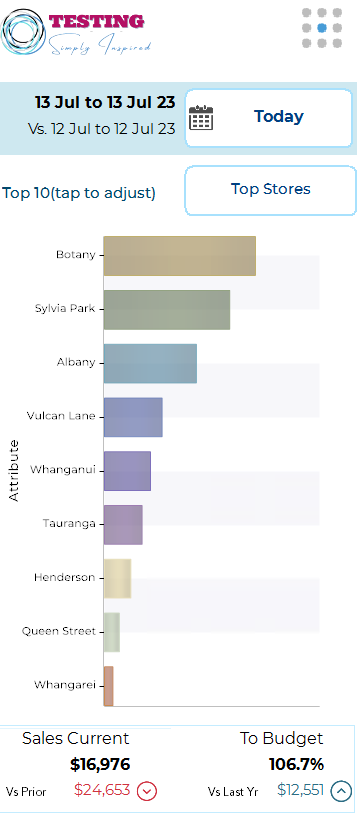
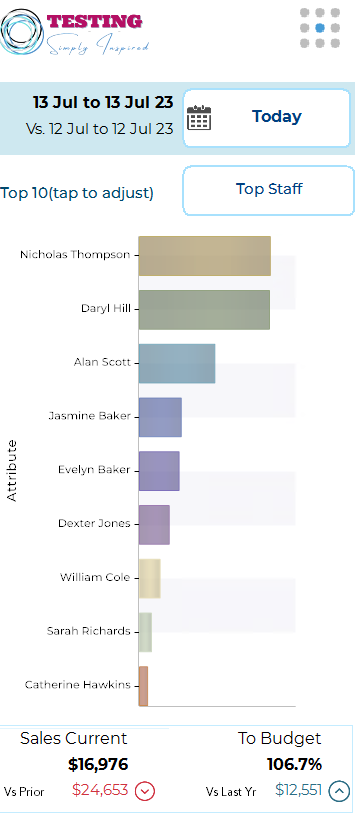
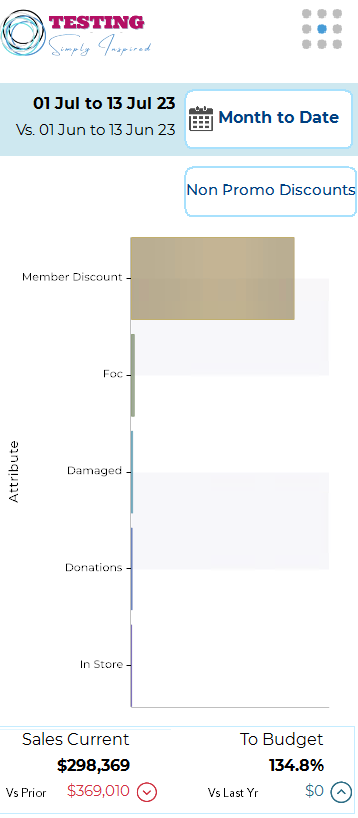
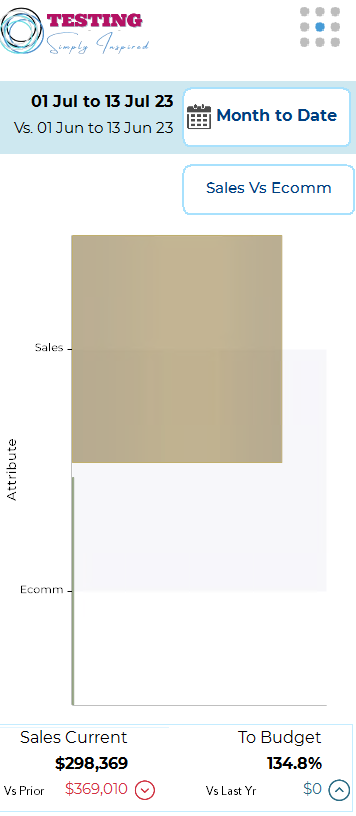
This page displays several easily readable KPI Graphs. The legend below provides the color codes for each bar. You can tap any segment of the graph to view the detailed values for that particular bar.
If you wish to see more series, you can adjust the number by tapping the label "Top 10 (tap to adjust)" and setting to the desired value.
Top Attributes |
Top Suppliers |
Top Stores |
Top Staff |
|
|
|
|
|
|
Here you easily see the top 5 Attributes in sales for the range. |
This will display the top 10 Suppliers for the range. |
Displays the stores ranking by sales for the range. |
Displays the top staff by Sale value across the company for a range. |
Top Staff |
Non Promo Discounts |
Sales by Channel |
|
|
|
|
|
Displays the top staff by Sale value across the company for a range. |
Provides a split of all non promotional discounts by reason. This excludes discounts on promotion, staff sales, Kit sales, Prices Break and Multibuys. |
Provides a breakdown of sales seperated by Sales Channel. |
