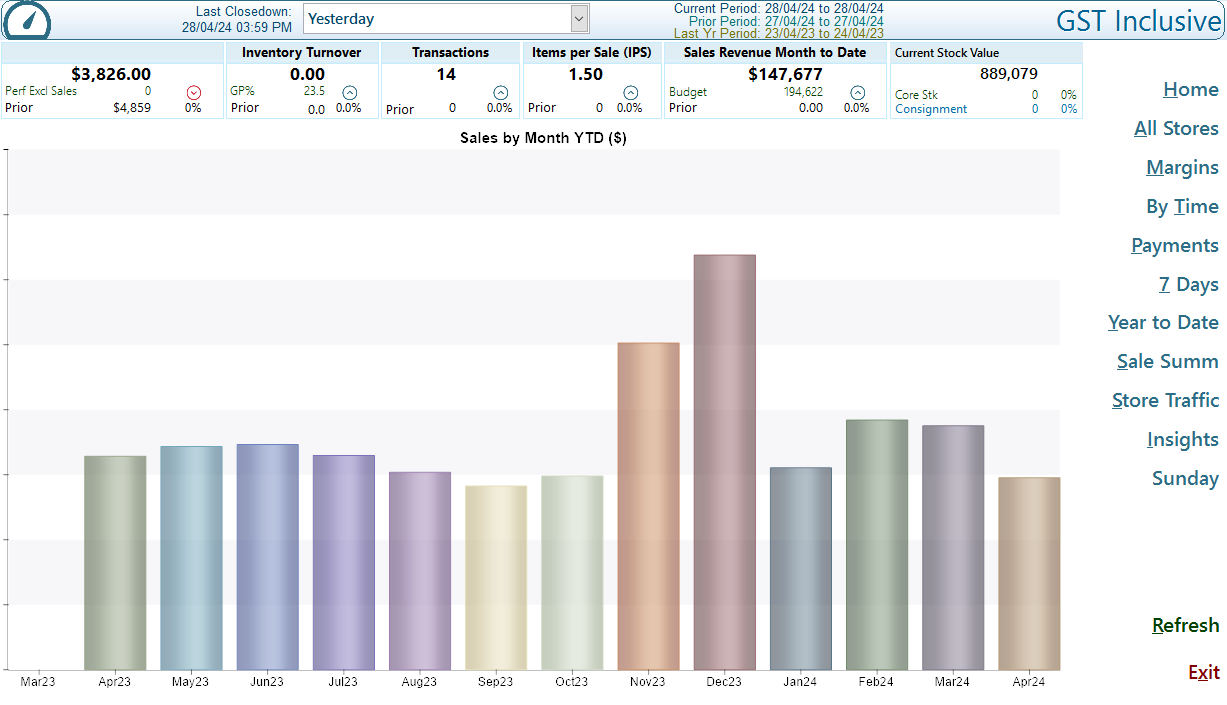
Dashboard
The Dashboard combines a series of Key Points Indicators (KPI) providing real-time insights into various aspects of the business, including sales performance, inventory levels, customer behaviour, and marketing effectiveness. This immediate access to data allows retailers to make informed, timely decisions.
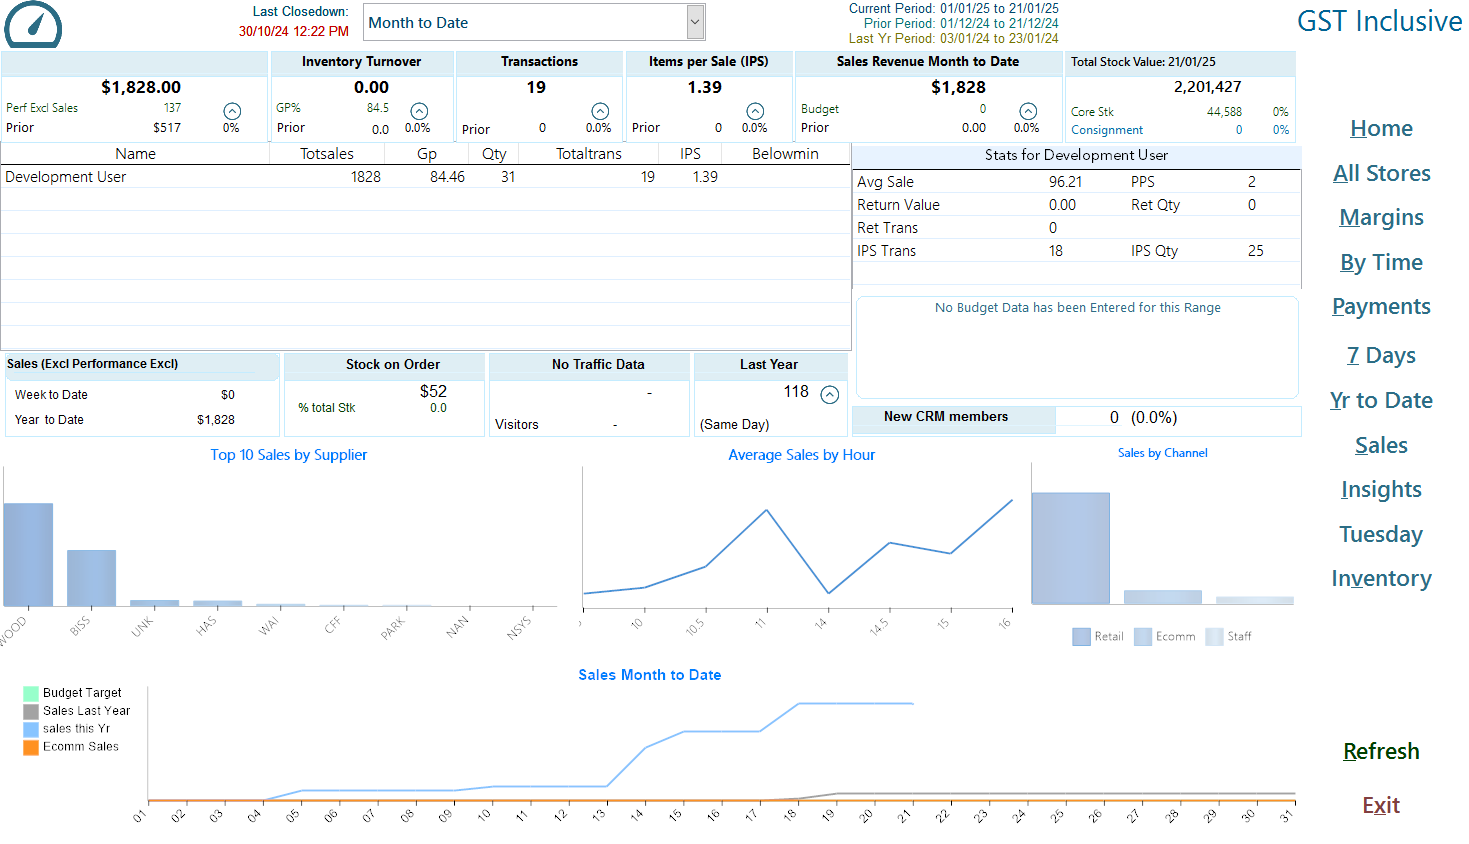
By default the date range is the current day, you may however select any date range using the date boxes in the top bar. click refresh to refresh the data for the selected range.
- The Top Bar
- The top bar comprises the total statistics for this location
- Staff performance Statistics
- The top left grid displays the sales performance for each staff. Selecting a staff member displays further sales performance statistics for that user
- Stock Breakdown
- The lower right grid displays the Total stock and how it is broken down
- Graph - Top 10 Sales by Supplier
- Graph - Sales split by the type
- Graph - Average sales per hour
- Graph - Sales for the current month compared to last year and budget. E-Commerce sales are separated
All Stores
(Enterprise Edition only)
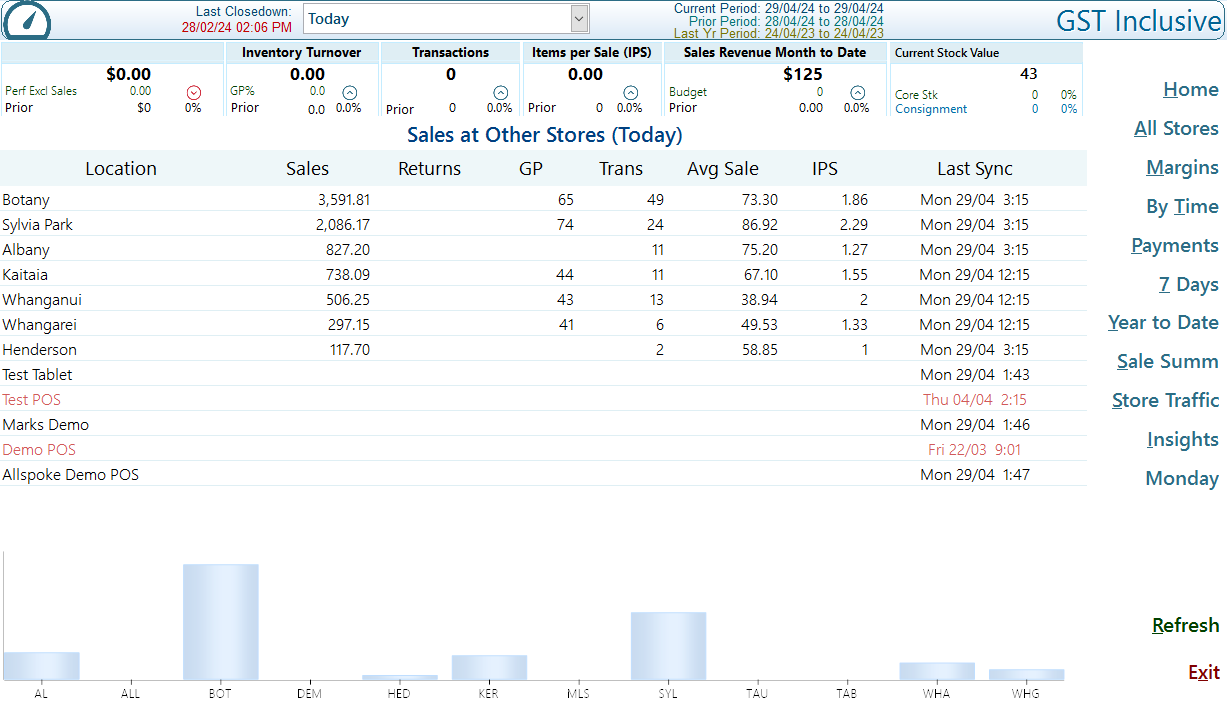
This screen shows a summary of performance stats at other company stores, your location is the one in bold font
Margin Management
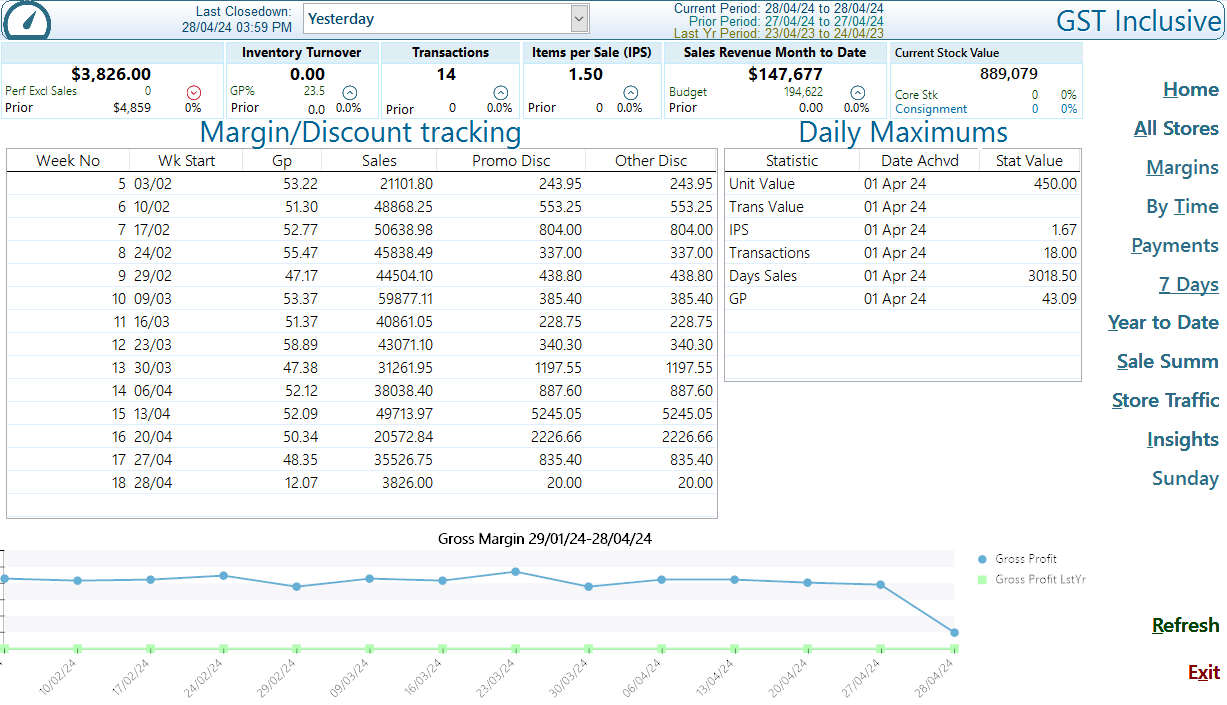
This page provides an overview of Margin Gross Profit statistics
Sales By Time
This page will show the number of transactions per 30mins, very useful for planning staff rostering.
When first opened the grid show the range figures consolidated. Each day for the last 7 days of the range is graphed.
to view the statistics for a particular day simply click on the graph.

To return the the consolidated grid view click on the <View for Range> button
Sales by payment and Delivery
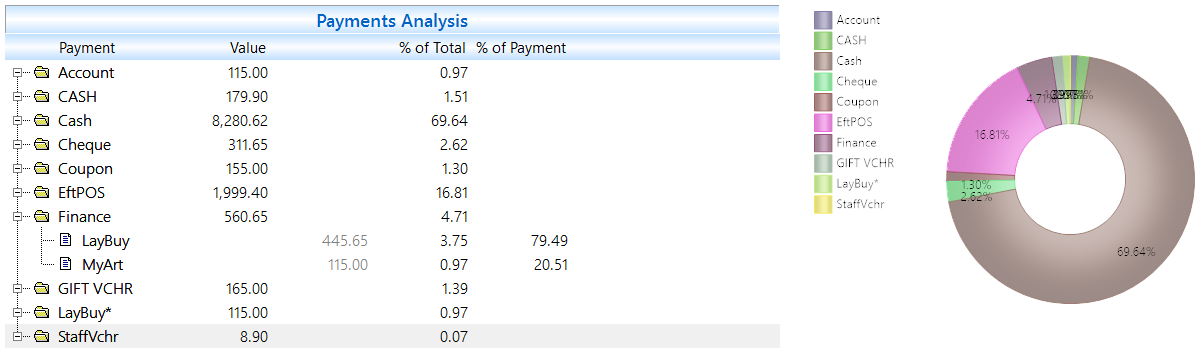
An overview of income by payment type and Sale type
7 Days
As the name suggests 7 days is a snapshot on a week by week basis Monday to Sunday.
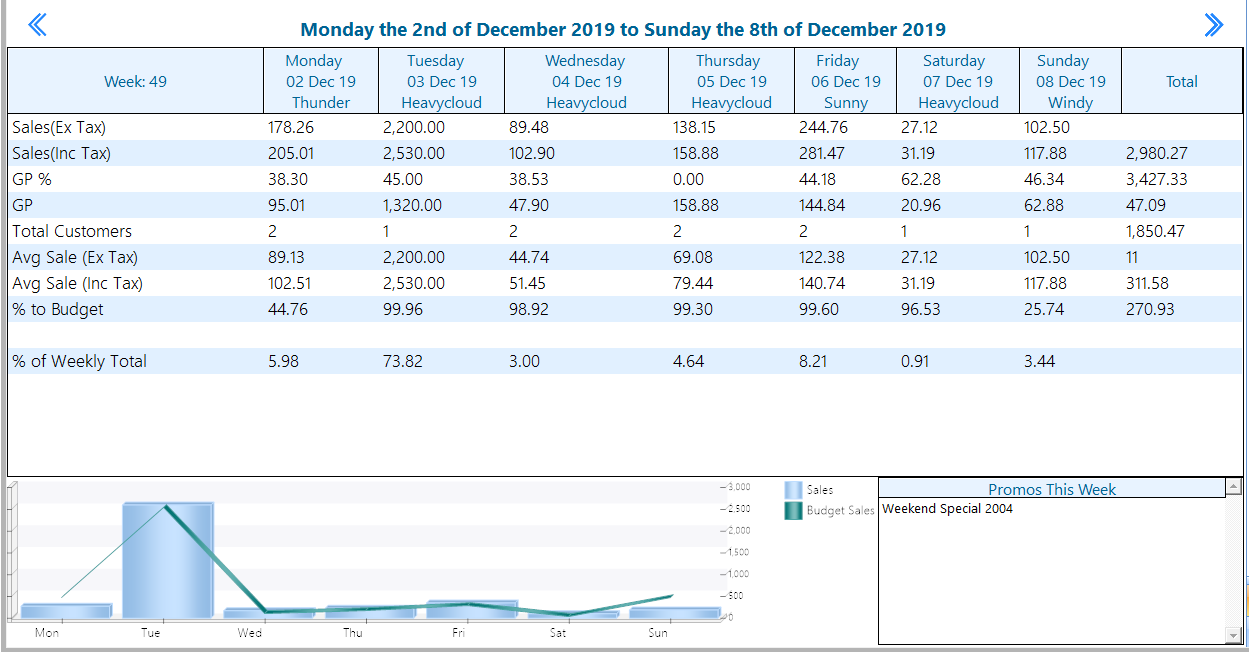
For the week we can easily see the Date/Day, the weather on that day and the sales statistics.
Sales and Budget are graphed for easy trend analysis while any Promotions active in that time are displayed in the lower left grid.
Year to Date
This page will display monthly sales for the last 13 months.
Inventory
This page provides an inventory snapshot. The upper section is stock on hand today by primary attribute.
The lower section graphs the inventory levels over the past year.

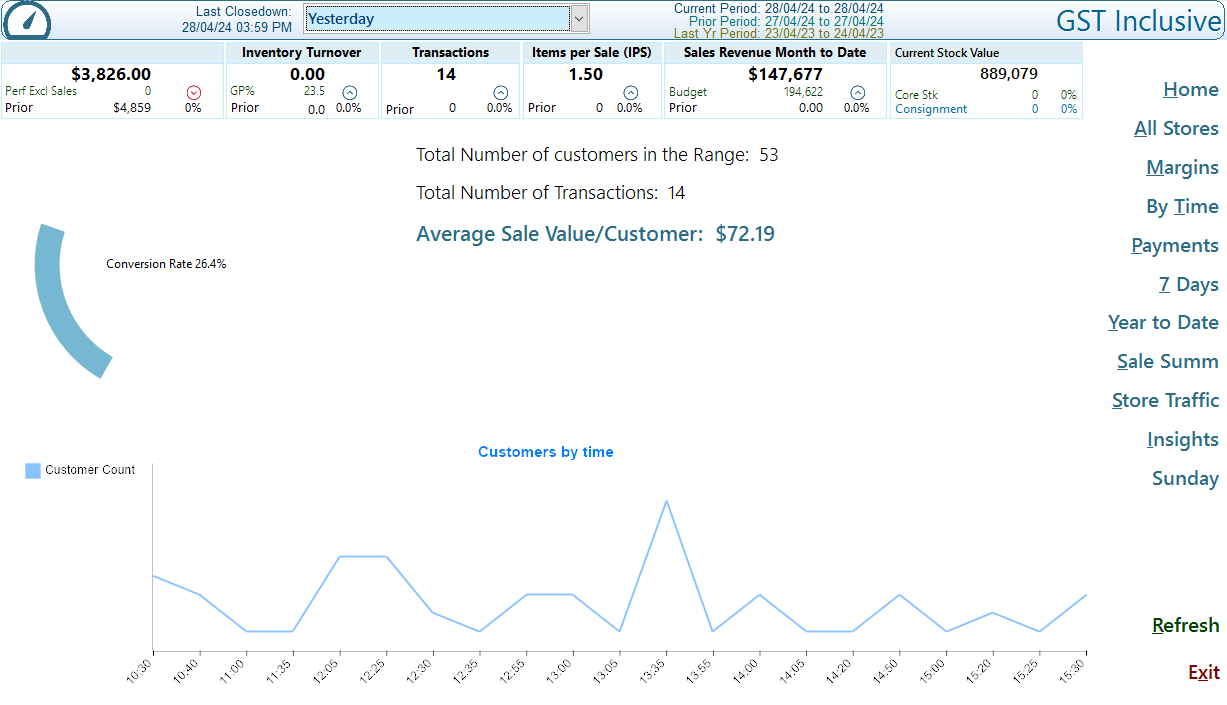
Store Traffic
Bellwether customer counting is a tool designed to track foot traffic in your store, helping you measure customer trends and store performance.
Purpose:
- Understand how many customers visit your store.
- Identify peak shopping times to optimise staffing and operations.
- Measure the effectiveness of marketing campaigns and promotions by correlating traffic with sales data.
Advantages:
- Data-Driven Decisions: Gain insights into customer behaviour to make informed business strategies.
- Improved Resource Allocation: Align staffing levels and store layouts with traffic patterns.
- Enhanced Customer Experience: Reduce wait times and improve service during busy periods.
By leveraging this tool, businesses can maximise efficiency, drive sales, and improve overall customer satisfaction. See Here for more Information.