Management Summary
Management Summary
Reports/Management Summary
The Ramsys Management Summary is designed to provide a comprehensive, yet intuitive, overview of key performance indicators (KPIs) critical to your business. It consolidates complex data into an easy-to-read format, ensuring decision-makers can quickly assess the health and performance of their operations.
Key features of the Management Summary include:
- Clear Visualisation: Charts, graphs, and concise tables for quick insights.
- Customisable Metrics: Focus on KPIs that matter most to your business, from sales performance and stock levels to customer retention and profitability.
- Real-Time Updates: Access the latest data to make informed decisions with confidence.
This summary empowers managers to stay informed, identify trends, and take proactive measures to ensure success in every aspect of their operations. With Ramsys, understanding your business has never been easier.

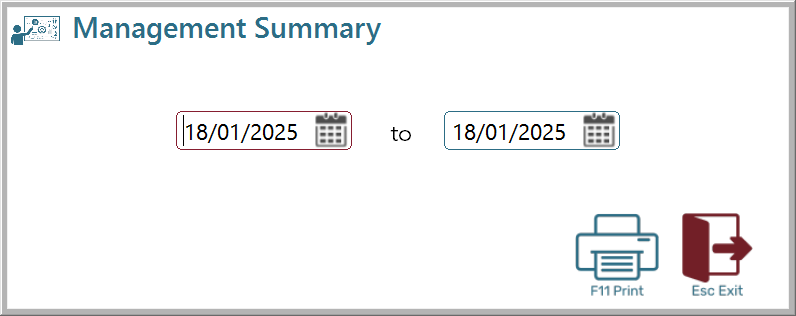
Simply select the required date and print. The report will print to screen. From here it can be Printed, emailed or saved as Excel/PDF/Text.
Note: This report can be set to be automatically emailed to an email address upon close down each night.

Key Metrics Included:
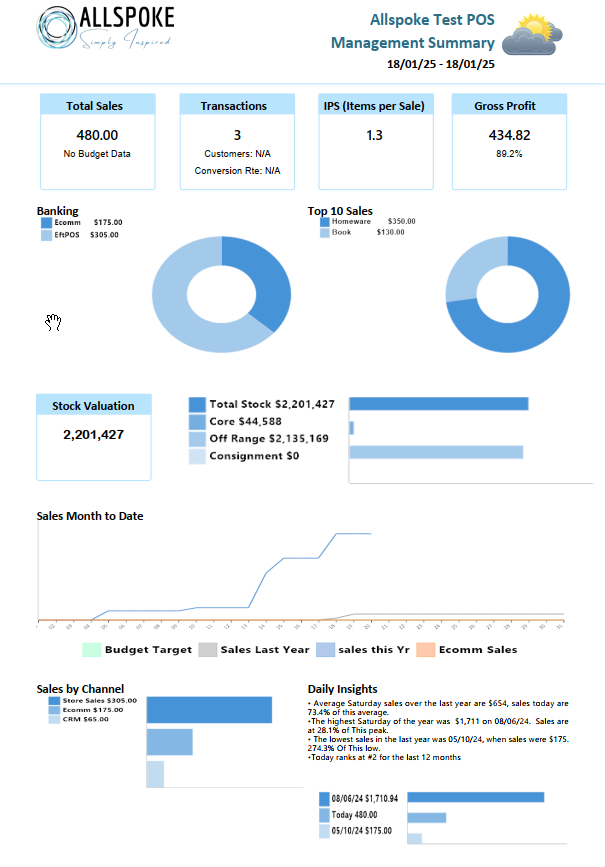
- Weather: A visual representation of the weather for the selected day or the last day in the range if a date range is selected.
- Total Sales: Displays total sales (including GST), budget figures (if entered), and the percentage of budget achieved.
- Transactions: Shows the number of transactions (customers served), actual customer count, and conversion rate (if traffic counting is available).
- Items per Sale (IPS): Tracks the average number of items per sale.
- Gross Profit: Presented both as a dollar value and as a percentage.
- Banking: Details payments taken, categorised by type, alongside a graph illustrating the split.
- Top 10 Sales: Highlights sales totals for the top 10 product groups, paired with a graphical representation for quick analysis.
- Stock Valuation: Provides the total stock value at cost (including GST) and visualises the split across different stock types.
- Sales MTD: Month-to-date sales figures for this year, last year, eCommerce, and the budget.
- Sales by Channel: Sales segmented by the channel they were processed from, displayed with a supporting graph.
- Daily Insights: A comparative analysis of the last day in the range, including the best, worst, and average sales for this day throughout the year, with graphical context.
This summary is the ultimate tool for managers to stay informed, identify trends, and compare performance benchmarks with ease. Ramsys ensures that every critical business metric is at your fingertips, helping you make proactive and strategic decisions for success.